
This documentation explains two methods for tracking and analyzing Action Button clicks within Google Analytics 4 (GA4).
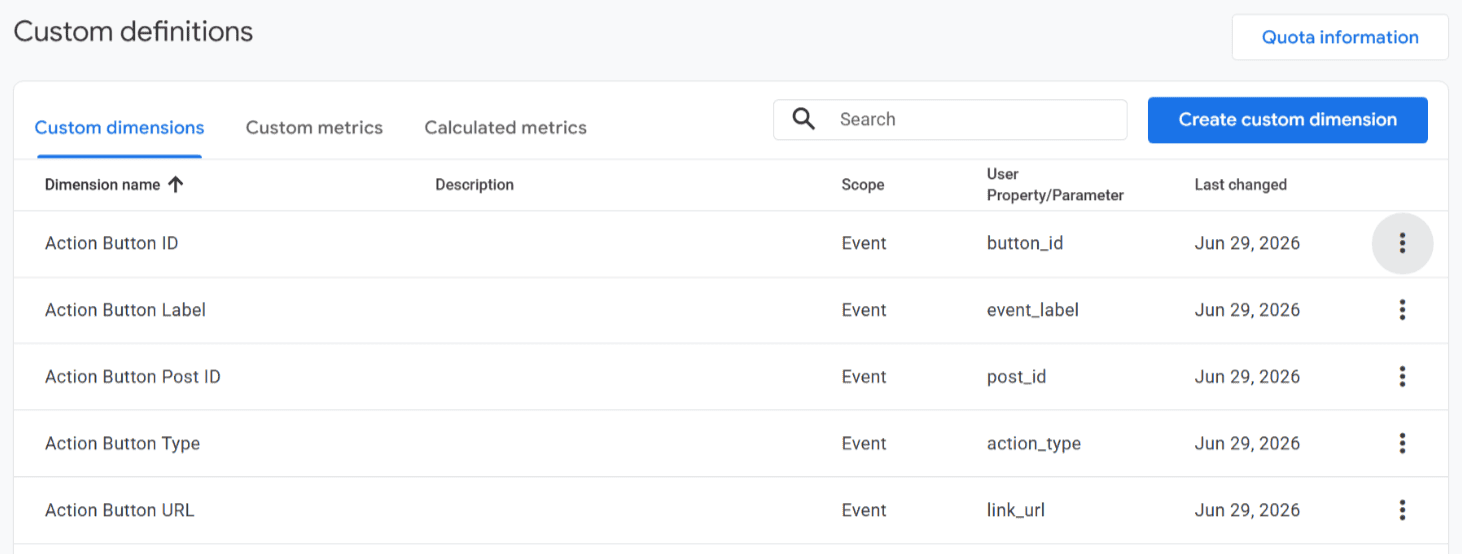
Before You Start: Register the Custom Dimensions (one-time setup) #
Hubbub sends your Action Button data to GA4 as event parameters on the action_button_click event. GA4 doesn’t automatically turn those into dimensions you can see in reports — you’ll want to register them once, and then you’re all set from there on out.
- In GA4, go to Admin → Data display → Custom definitions → Create custom dimension.
- Create one custom dimension for each Action Button field below, all with Scope: Event, using the exact event parameter name Hubbub sends (not the friendly label):
- Action Button URL → parameter
link_url - Action Button Type → parameter
action_type - Action Button Label → parameter
event_label - Action Button Post ID → parameter
post_id - Action Button ID → parameter
button_id
3. Save. Two things to expect after registering:
- Not retroactive — a custom dimension only starts collecting data from the moment you create it. Clicks that happened before registration won’t appear in it.
- Processing delay — allow roughly 24–48 hours before the new dimensions show up in Reports and in the Exploration dimension picker.
Quick sanity check before troubleshooting further: go to Reports → Engagement → Events and look for action_button_click in the events list.
- If it’s there, tracking is working — you’re only missing the reporting-side registration above.
- If it’s not there at all, the issue is upstream of GA4: confirm a GA4 Measurement ID is saved in Hubbub’s Action Buttons settings, and that
window.gtagis present on the site (this can be missed on sites where GA is injected via GTM or a third-party ad partner without a gtag shim).
Quick Overview via Events Report #
The fastest approach uses GA4’s built-in Events report:
- Navigate to Reports > Engagement > Events
- Select action_button_click from the table
- Review summary metrics including total clicks and unique user counts
→ Once the custom dimensions above are registered (and have had time to process), you can also view button URL, type, label, post ID, and button ID for individual events here. Until they’re registered, this view only shows aggregate metrics (total clicks, unique users) — not the per-attribute breakdown.
Deeper Analysis via Custom Exploration #
For more granular analysis, GA4 Explorations allow customized reporting:
Setup steps:
- Access Explore and choose Blank exploration
- Name the report (e.g., “Action Button Performance”)
- Add dimensions: event name, page path, button label, button type, and button URL
- Add metrics: event count and total users
- Arrange dimensions in Rows and metrics in Values sections
→ Note: the button label/type/URL/post ID/button ID dimensions only appear in the Exploration dimension picker after they’ve been registered as Custom definitions (see “Before You Start” above) and GA4 has had time to process data against them.
Critical filtering step: Apply a filter where “Event name exactly matches action_button_click” to ensure you’re viewing only button interactions, not all events. Optionally filter by specific page paths.
This approach reveals performance comparisons across buttons, pages, and placements that basic reporting cannot surface.